
Production Benchmark Results
Real-world performance testing of Queen MQ under sustained production-like workloads.
Test Environment
- Hardware: 32 cores, 64GB RAM, 2TB NVMe disk
- Deployment: Docker containers (Queen + PostgreSQL)
- Network: Docker bridge network, no CPU pinning
- Queen Version: 0.11.0
Summary
| Test | Throughput | Duration | Resources |
|---|---|---|---|
| Sustained Load | ~10,000 req/s | 3 days continuous | Queen: 133 MB RAM, ~3 cores |
| Batch Push | ~31,000 msg/s | Sustained | Disk: ~1 GB/s write |
| Consumer Groups | 60,000 msg/s (10 groups) | Sustained | Queen: 1 GB RAM, ~3 cores |
1. Sustained Load Test
Goal: Validate Queen can handle continuous high-throughput workloads without degradation.
Configuration
Queen Server:
docker run -d --ulimit nofile=65535:65535 \
  --name queen -p 6632:6632 --network queen \
  -e PG_HOST=postgres \
  -e PG_PASSWORD=postgres \
  -e NUM_WORKERS=10 \
  -e DB_POOL_SIZE=50 \
  -e SIDECAR_POOL_SIZE=250 \
  -e SIDECAR_MICRO_BATCH_WAIT_MS=20 \
smartnessai/queen-mq:0.11.0PostgreSQL:
docker run -d --ulimit nofile=65535:65535 \
  --name postgres --network queen \
  -e POSTGRES_PASSWORD=postgres -p 5432:5432 \
  postgres \
  -c shared_buffers=4GB \
  -c max_connections=300 \
  -c max_wal_size=16GB \
  -c synchronous_commit=off \
-c autovacuum_vacuum_cost_limit=2000Workload
| Component | Configuration |
|---|---|
| Queue | 1 queue, 1000 partitions |
| Producers | 10 workers, 1000 total connections, 1 msg/request |
| Consumer | 1 worker, 50 connections, batch size 50, autoAck |
Results
2+ billion messages processed over 3 days at ~10,000 msg/s
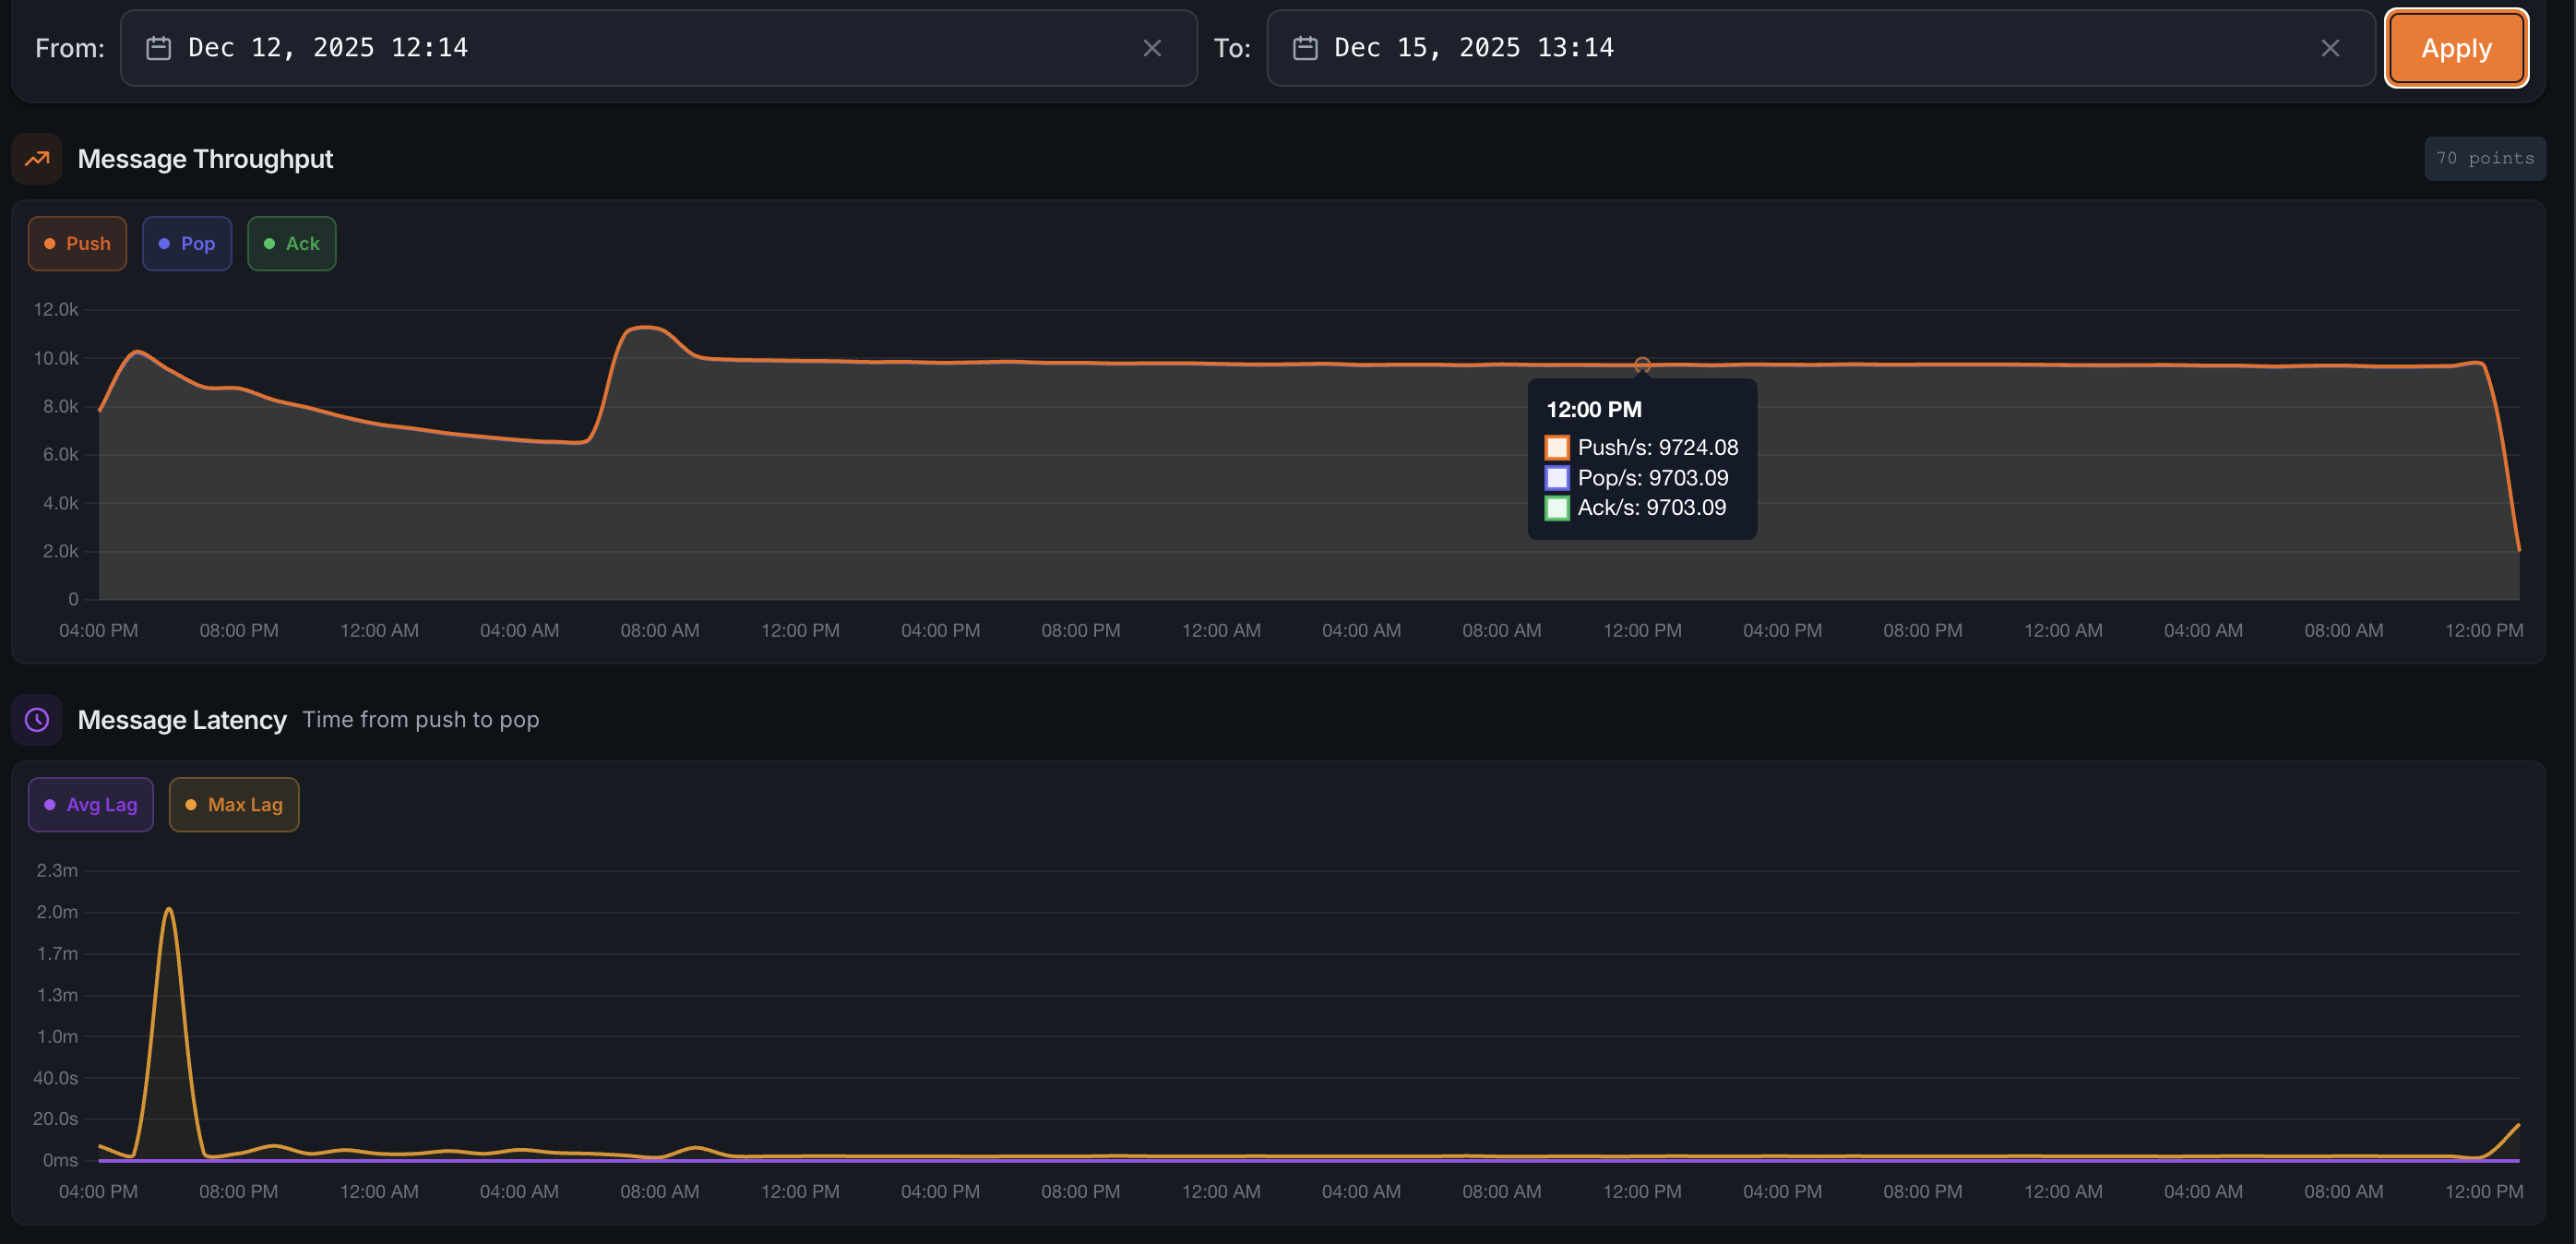 Stable throughput between 9,500-10,500 req/s over the entire test duration
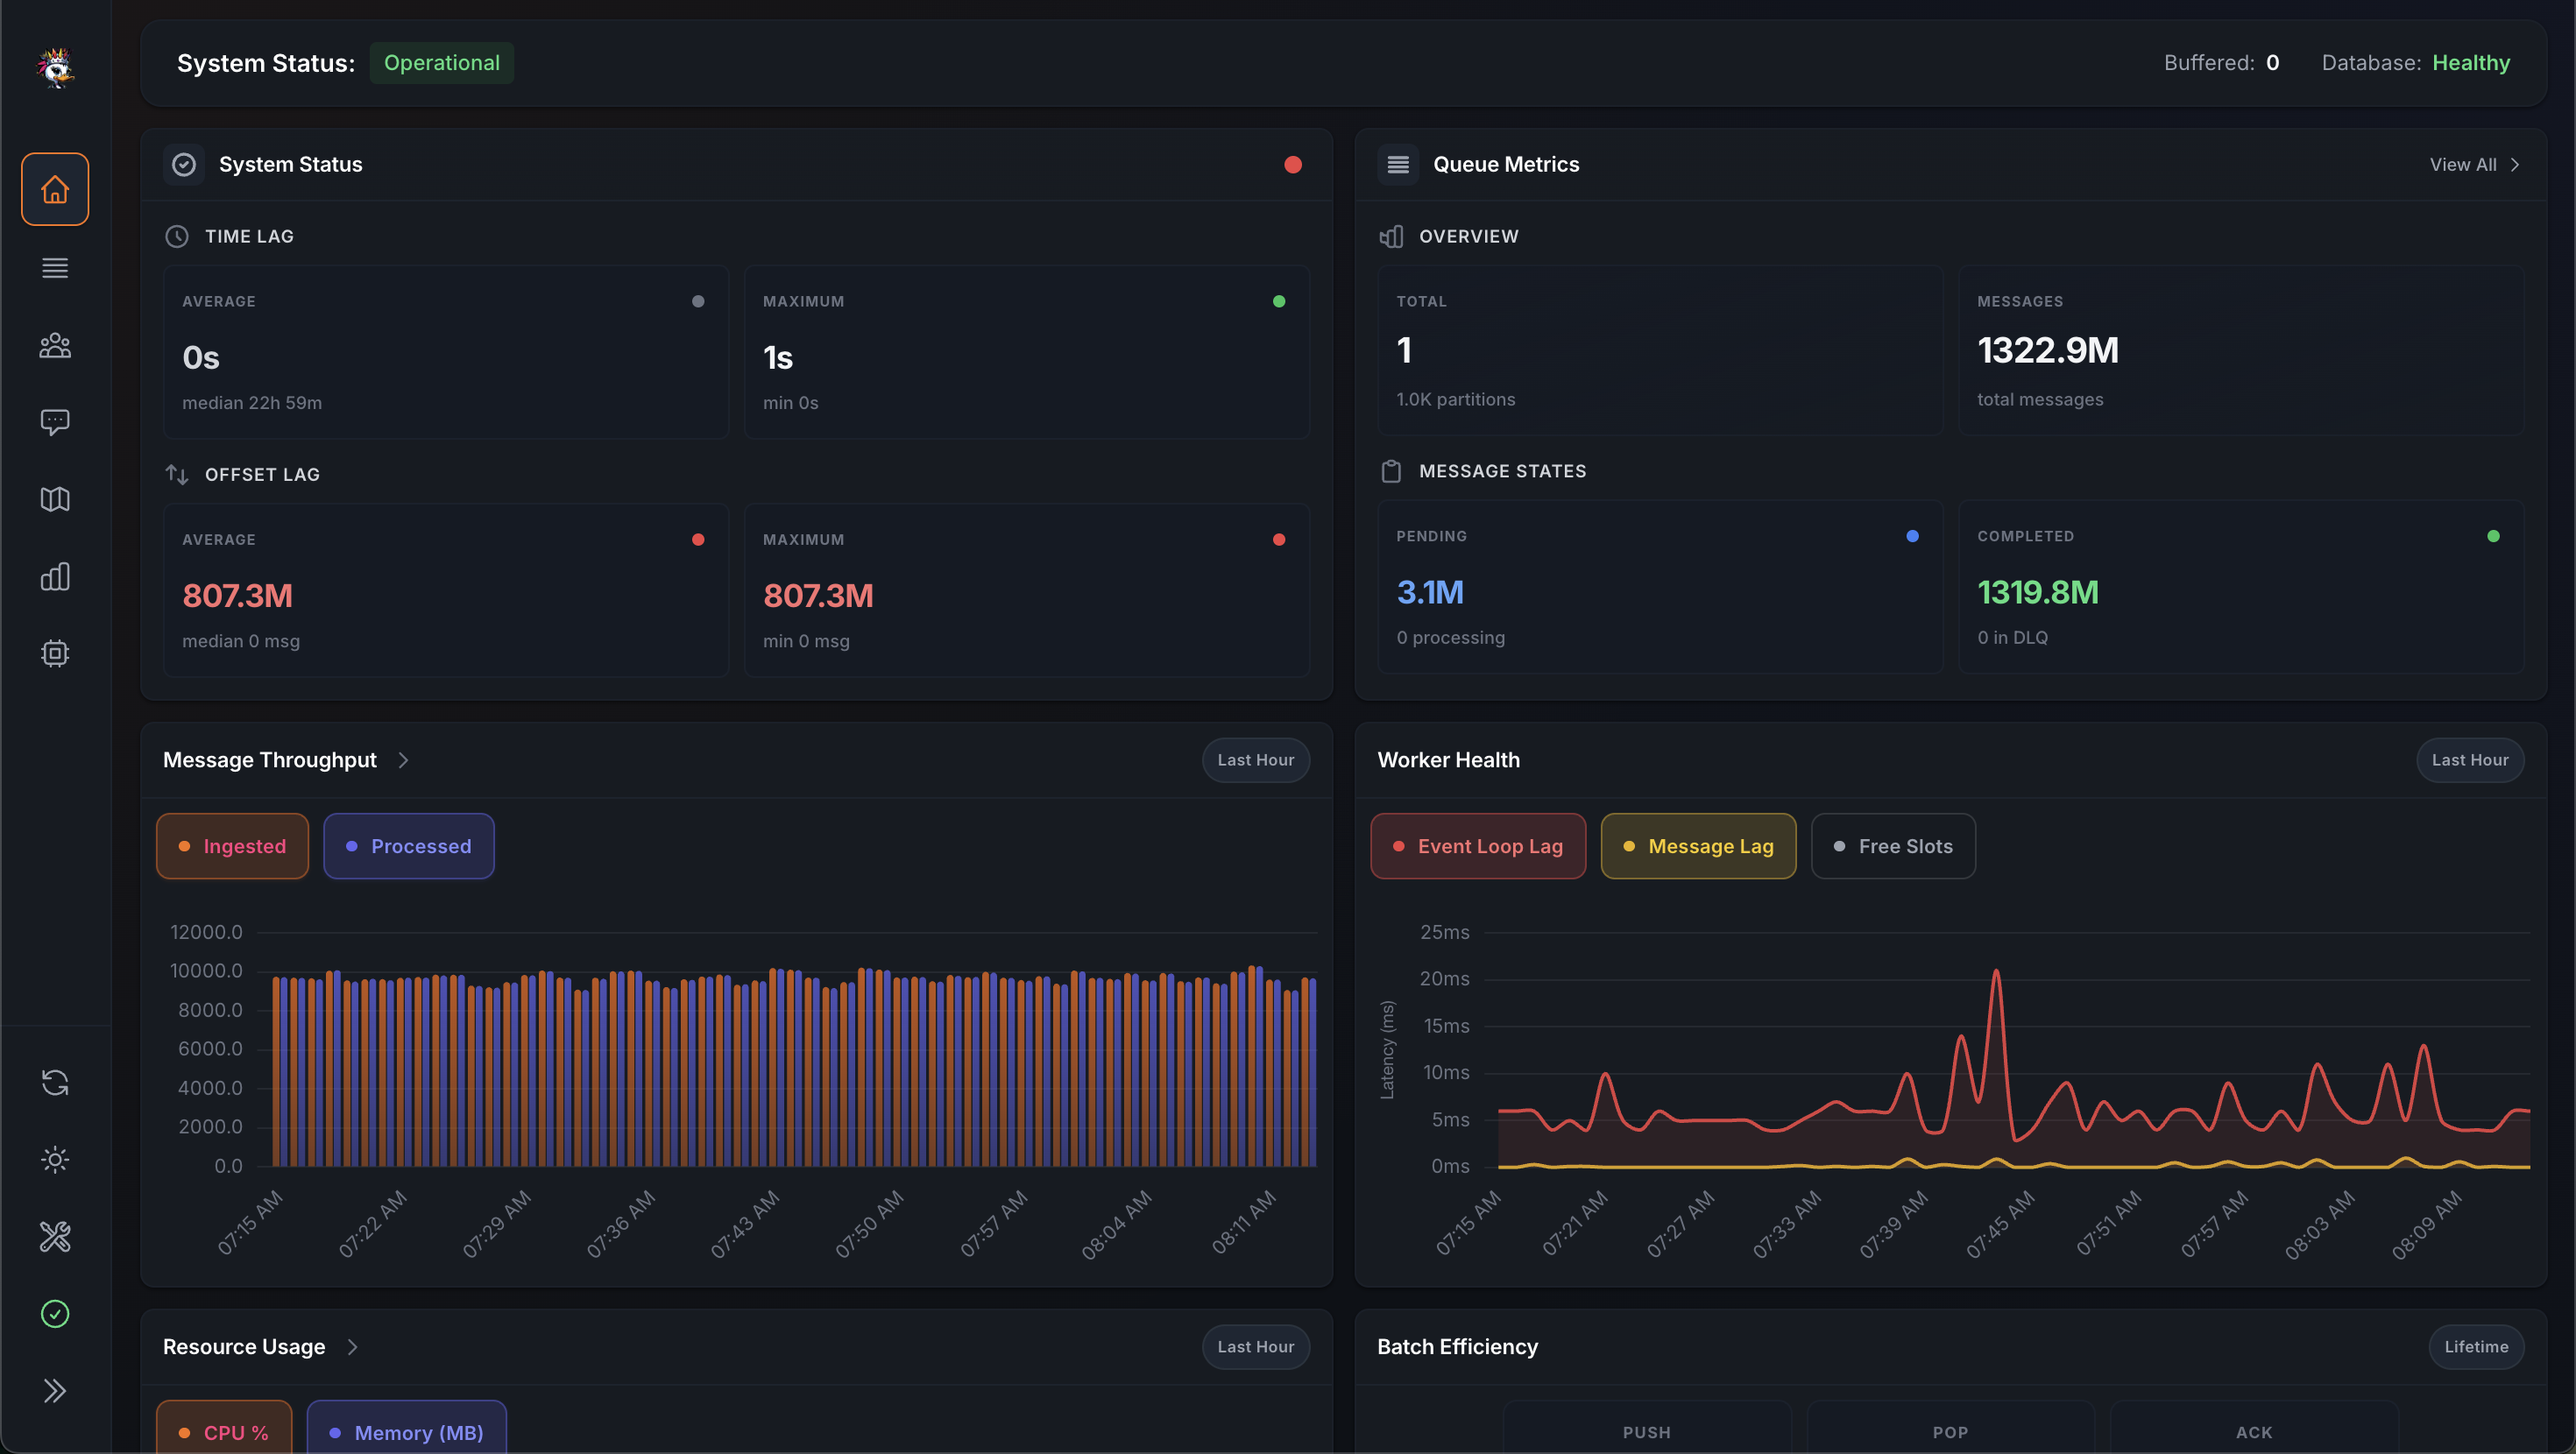 First 1.322 billion messages processed
Resource Usage
After 2.5 days of continuous operation:
| Container | CPU | Memory | Network I/O | Disk I/O |
|---|---|---|---|---|
| Queen | 325% | 146.5 MB | 2.55 TB / 6.64 TB | 14.3 MB / 0 B |
| PostgreSQL | 1001% | 46.82 GB | 456 GB / 982 GB | 30.1 GB / 43.3 TB |
Key findings:
- Queen memory usage remained constant at ~133 MB throughout the test
- Disk usage stabilized at 80 GB with aggressive retention (30-minute message lifetime)
- No performance degradation observed over the test duration
2. Batch Push Performance
Goal: Test maximum throughput with batched message production.
Configuration
- Batch size: 1,000 messages per request
- Message payload: Standard JSON payload
PostgreSQL Tuning
shared_buffers=1GB
temp_buffers=64MB
work_mem=64MB
max_wal_size=4GB
min_wal_size=1GBALTER TABLE queen.messages SET (
autovacuum_vacuum_scale_factor = 0.001,
autovacuum_vacuum_threshold = 100,
autovacuum_vacuum_cost_delay = 0,
autovacuum_vacuum_cost_limit = 10000
);Results
31,170 msg/s sustained throughput
 Consistent 30K+ msg/s throughput
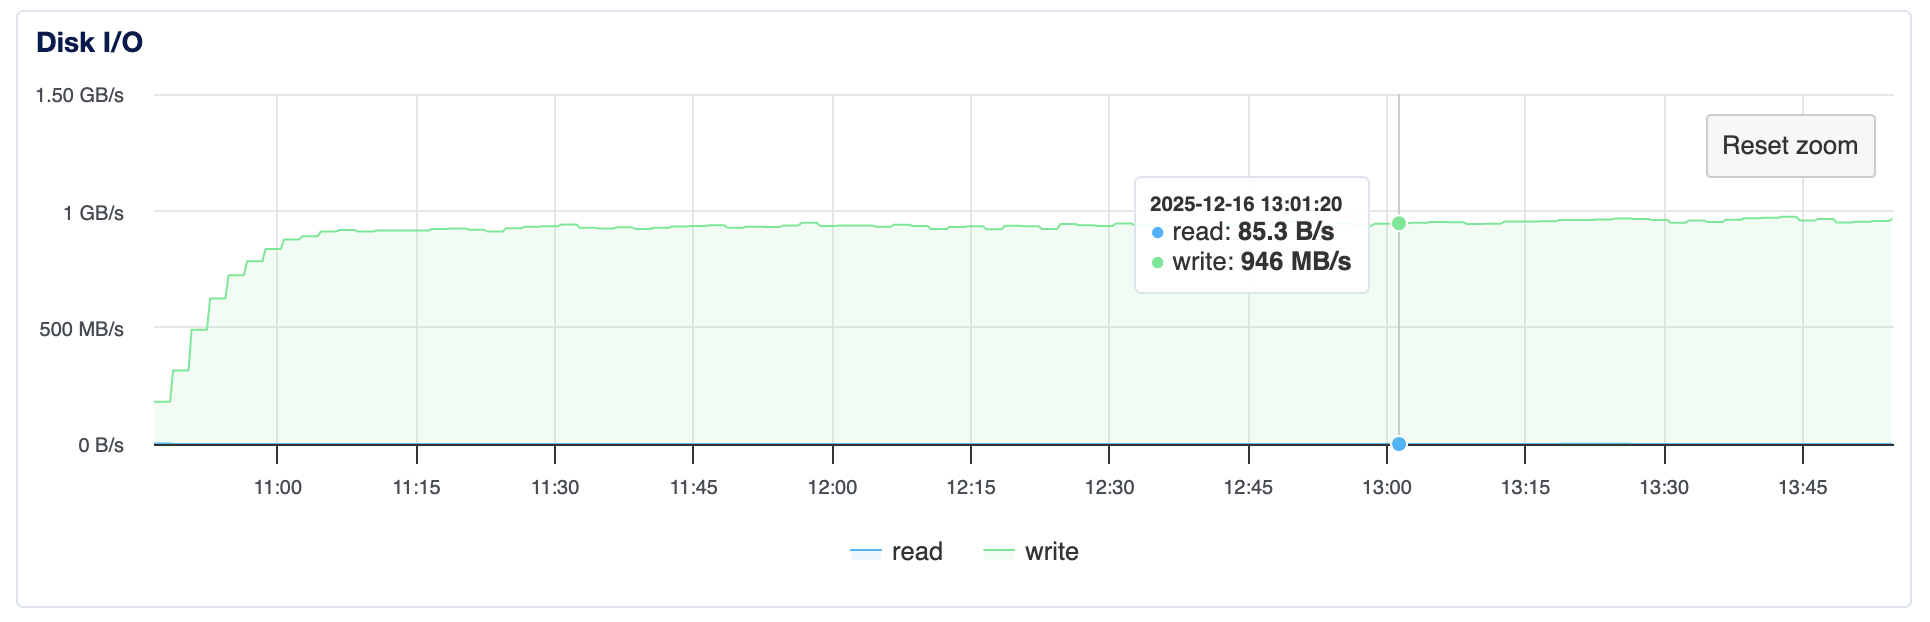 Disk write speed approaching 1 GB/s (10 Gbps)
| Metric | Value |
|---|---|
| Throughput | 31,170 msg/s |
| Disk Write | ~1 GB/s |
| Messages/minute | 2M+ |
3. Consumer Groups (Pub/Sub)
Goal: Test scalability of consumer group feature with multiple parallel consumers.
Configuration
| Component | Configuration |
|---|---|
| Queue | 1 queue, 1000 partitions |
| Producer | 1 producer, 100 connections, batch size 10 |
| Consumers | 10 consumer groups, 5 workers each, 50 connections per worker |
Results
60,000 msg/s consumption rate (6K push × 10 consumer groups)
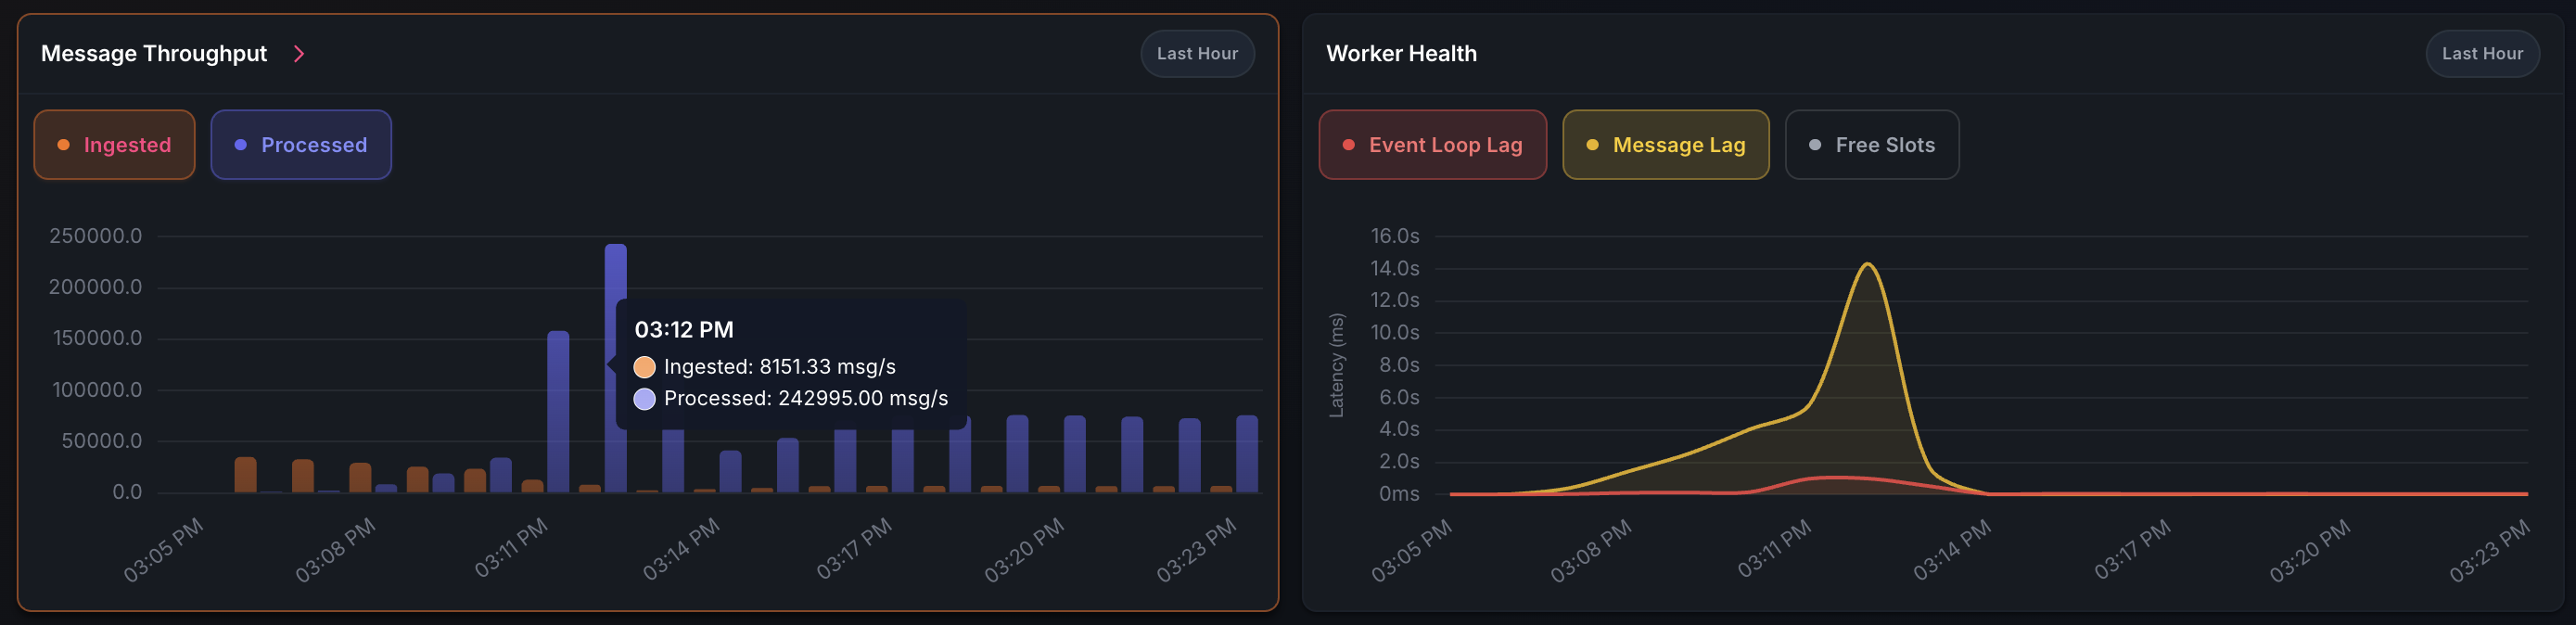 Peak performance: 250K msg/s pop throughput during catch-up phase
 Steady state: 6K push / 60K pop msg/s with ~3 cores and 1 GB RAM
| Phase | Push Rate | Pop Rate | CPU Usage | Memory |
|---|---|---|---|---|
| Catch-up | N/A | 250,000 msg/s | 10 cores | 1 GB |
| Steady state | 6,000 msg/s | 60,000 msg/s | 3 cores | 1 GB |
Performance Optimization Notes
PostgreSQL Tuning
For sustained high-throughput workloads:
- WAL Configuration: Increase
max_wal_sizeto reduce checkpoint frequency - Autovacuum: Aggressive settings prevent dead tuple accumulation
- Synchronous Commit:
offfor maximum write performance